TCMap (Traffic Count Map)
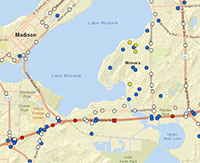 The Wisconsin Department of Transportation (WisDOT) provides traffic counts via an
interactive map that allows you to view counts anywhere in the state. This mapping application, called
TCMap, replaces a Google map that was in use from 2012-2018. TCMap enables users to search, pan and zoom to areas throughout the state to view AADTs, both continuous and short duration. The data included will provide users the most recent volume count as well as historical data if available.
The Wisconsin Department of Transportation (WisDOT) provides traffic counts via an
interactive map that allows you to view counts anywhere in the state. This mapping application, called
TCMap, replaces a Google map that was in use from 2012-2018. TCMap enables users to search, pan and zoom to areas throughout the state to view AADTs, both continuous and short duration. The data included will provide users the most recent volume count as well as historical data if available.
Traffic counts are reported as the number of vehicles expected to pass a given location on an average day of the year. This value is called the "annual average daily traffic" or AADT and is represented on traffic count or traffic volume maps. The AADT is based on a short duration traffic count, usually 48 hours, taken at the location. This count is then adjusted for the variation in traffic volume throughout the year and the average number of axles per vehicle. Short duration counts are collected over three, six, or 10-year cycles at more than 26,000 rural and urban locations throughout the state.
Historical traffic counts
Before the creation of the interactive traffic count map, data from 2000 to 2010 was made available on county and municipality PDFs. This same information is now available in the interactive map. Contact the
DOT Traffic Data Unit if you need a PDF that was available on the former WisDOT website.
WisDOT collects
continuous count data from about 370 permanent data collection locations primarily located on the state highway system. Data at continuous count sites are scheduled for collection in hourly intervals each day of the year.
Traffic forecasting is an important component of WisDOT planning, design and operations. It transforms a wide array of traffic, demographic and economic data into information essential to engineers, intercity and urban planners, project programmers and policy makers.